
You must log in or register to comment.
“I’ll believe corporations are people when Texas executes one.”
Source of diagram?
Someone on Reddit found the source:
website with write up and graph
Website where the numbers came from
Edit: Re(ve)ddit link from 2 yrs ago if anyone cares.
(Also x-posted from the other post)
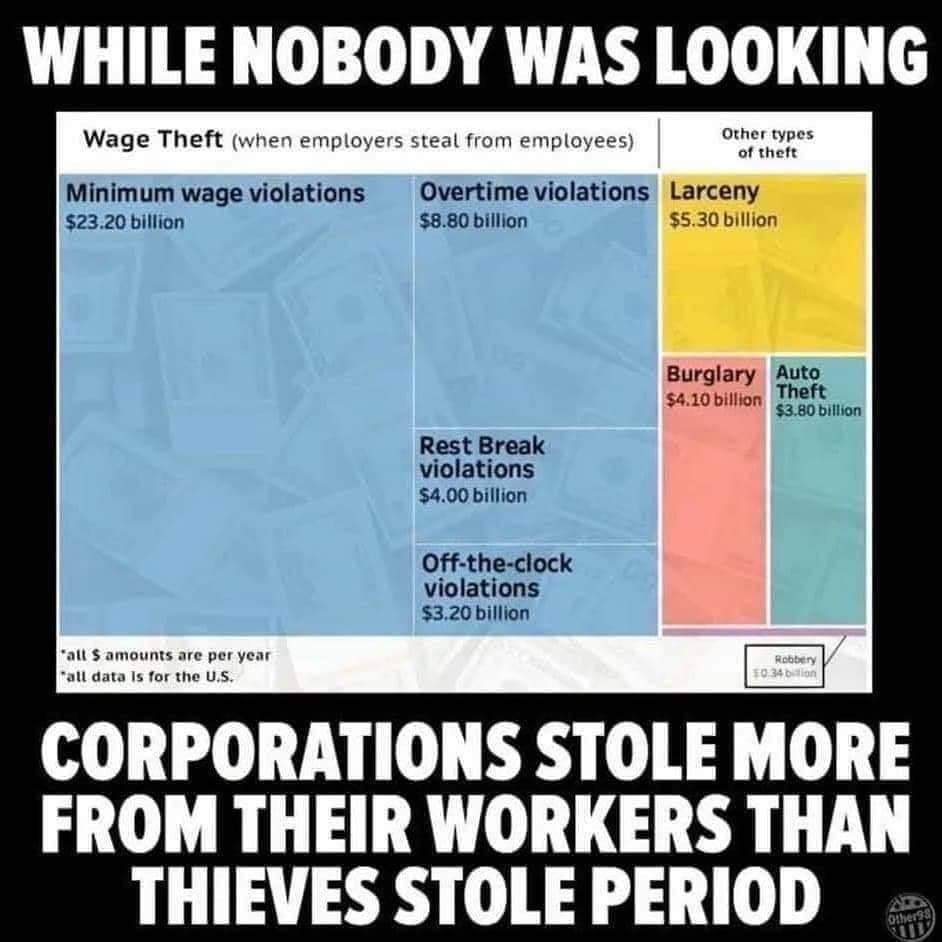
what’s the time frame on this? how far back are the records we’re looking at? is this JUST fiscal year 2022 or something? is it global, national, or regional?

P.S. the year isn’t mentioned in the image though, it was mentioned in an article shared by someone else in the comments as pre-2018
so it’s possible the numbers are even more damning and egregious than they look even here
Well, it’s possible they go the other way but…
Yeah this is probably true, but this graphic is trash because it doesn’t have a citation, or scale
It’s right there in the lower left corner.
*Other thieves…
They’re all thieves.
Thieves stole period? Oh no, now I’ll have to end my sentences in either question or exclamation marks!
Possibly you could use an interrobang‽
Somebody else knows about interrobangs‽ Terrific!

